Pet Insight is on a mission to improve life for every pet
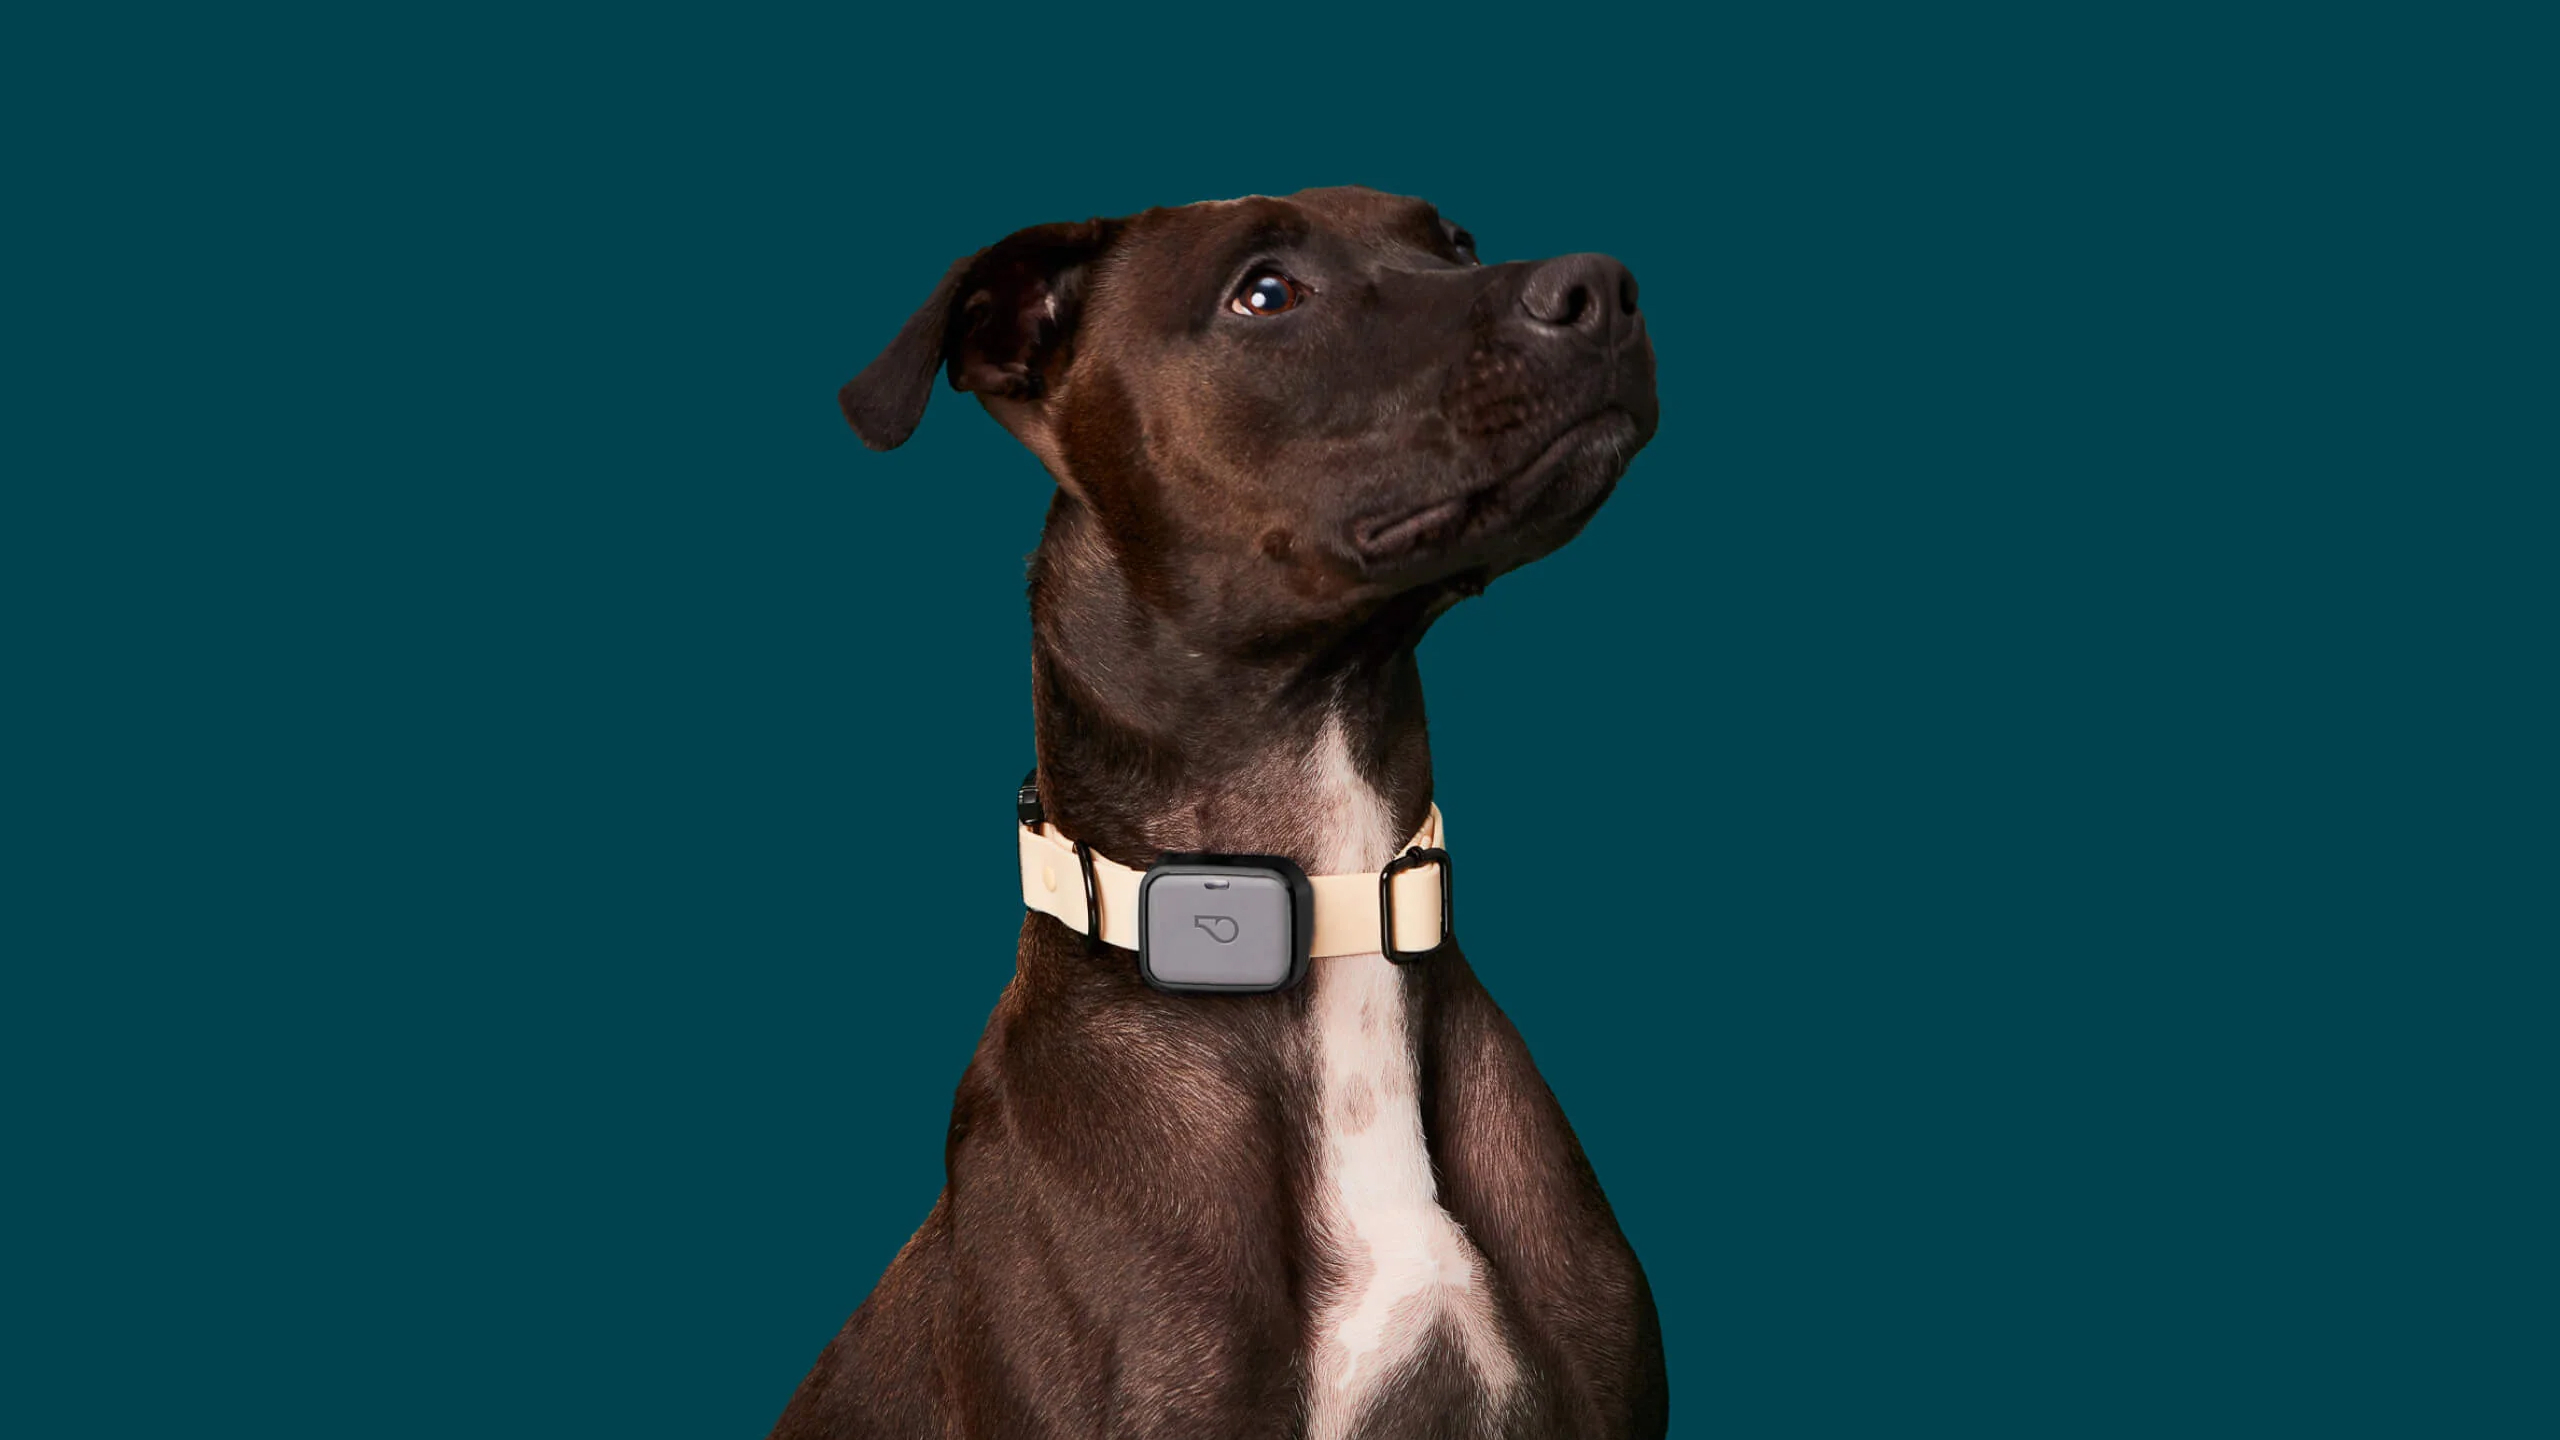
Pet Insight Project is a research-backed mobile app that pairs with Whistle FIT a collar-worn activity tracker, to monitor dog health metrics like sleep, activity, mobility, and skin condition. The platform collects behavioral data from hundreds of thousands of dogs to surface health insights for individual owners and contribute to veterinary research.
I joined as Product Designer to redesign the core experience: the wellness dashboard and habit tracker. The central design challenge was translating complex, multi-source health data (device sensors + owner-reported observations) into a daily view that a non-technical pet owner could understand and act on. While keeping the data accurate enough to be clinically useful when shared with veterinarians.
The Challenge
The existing Pet Insight app collected data but struggled to make it meaningful. Three core problems shaped the redesign:
- Two data sources, one dashboard. The Whistle FIT device captured objective metrics (steps, sleep duration, activity intensity) automatically. But important health indicators — skin condition, ear health, appetite changes — required the owner to manually log observations.
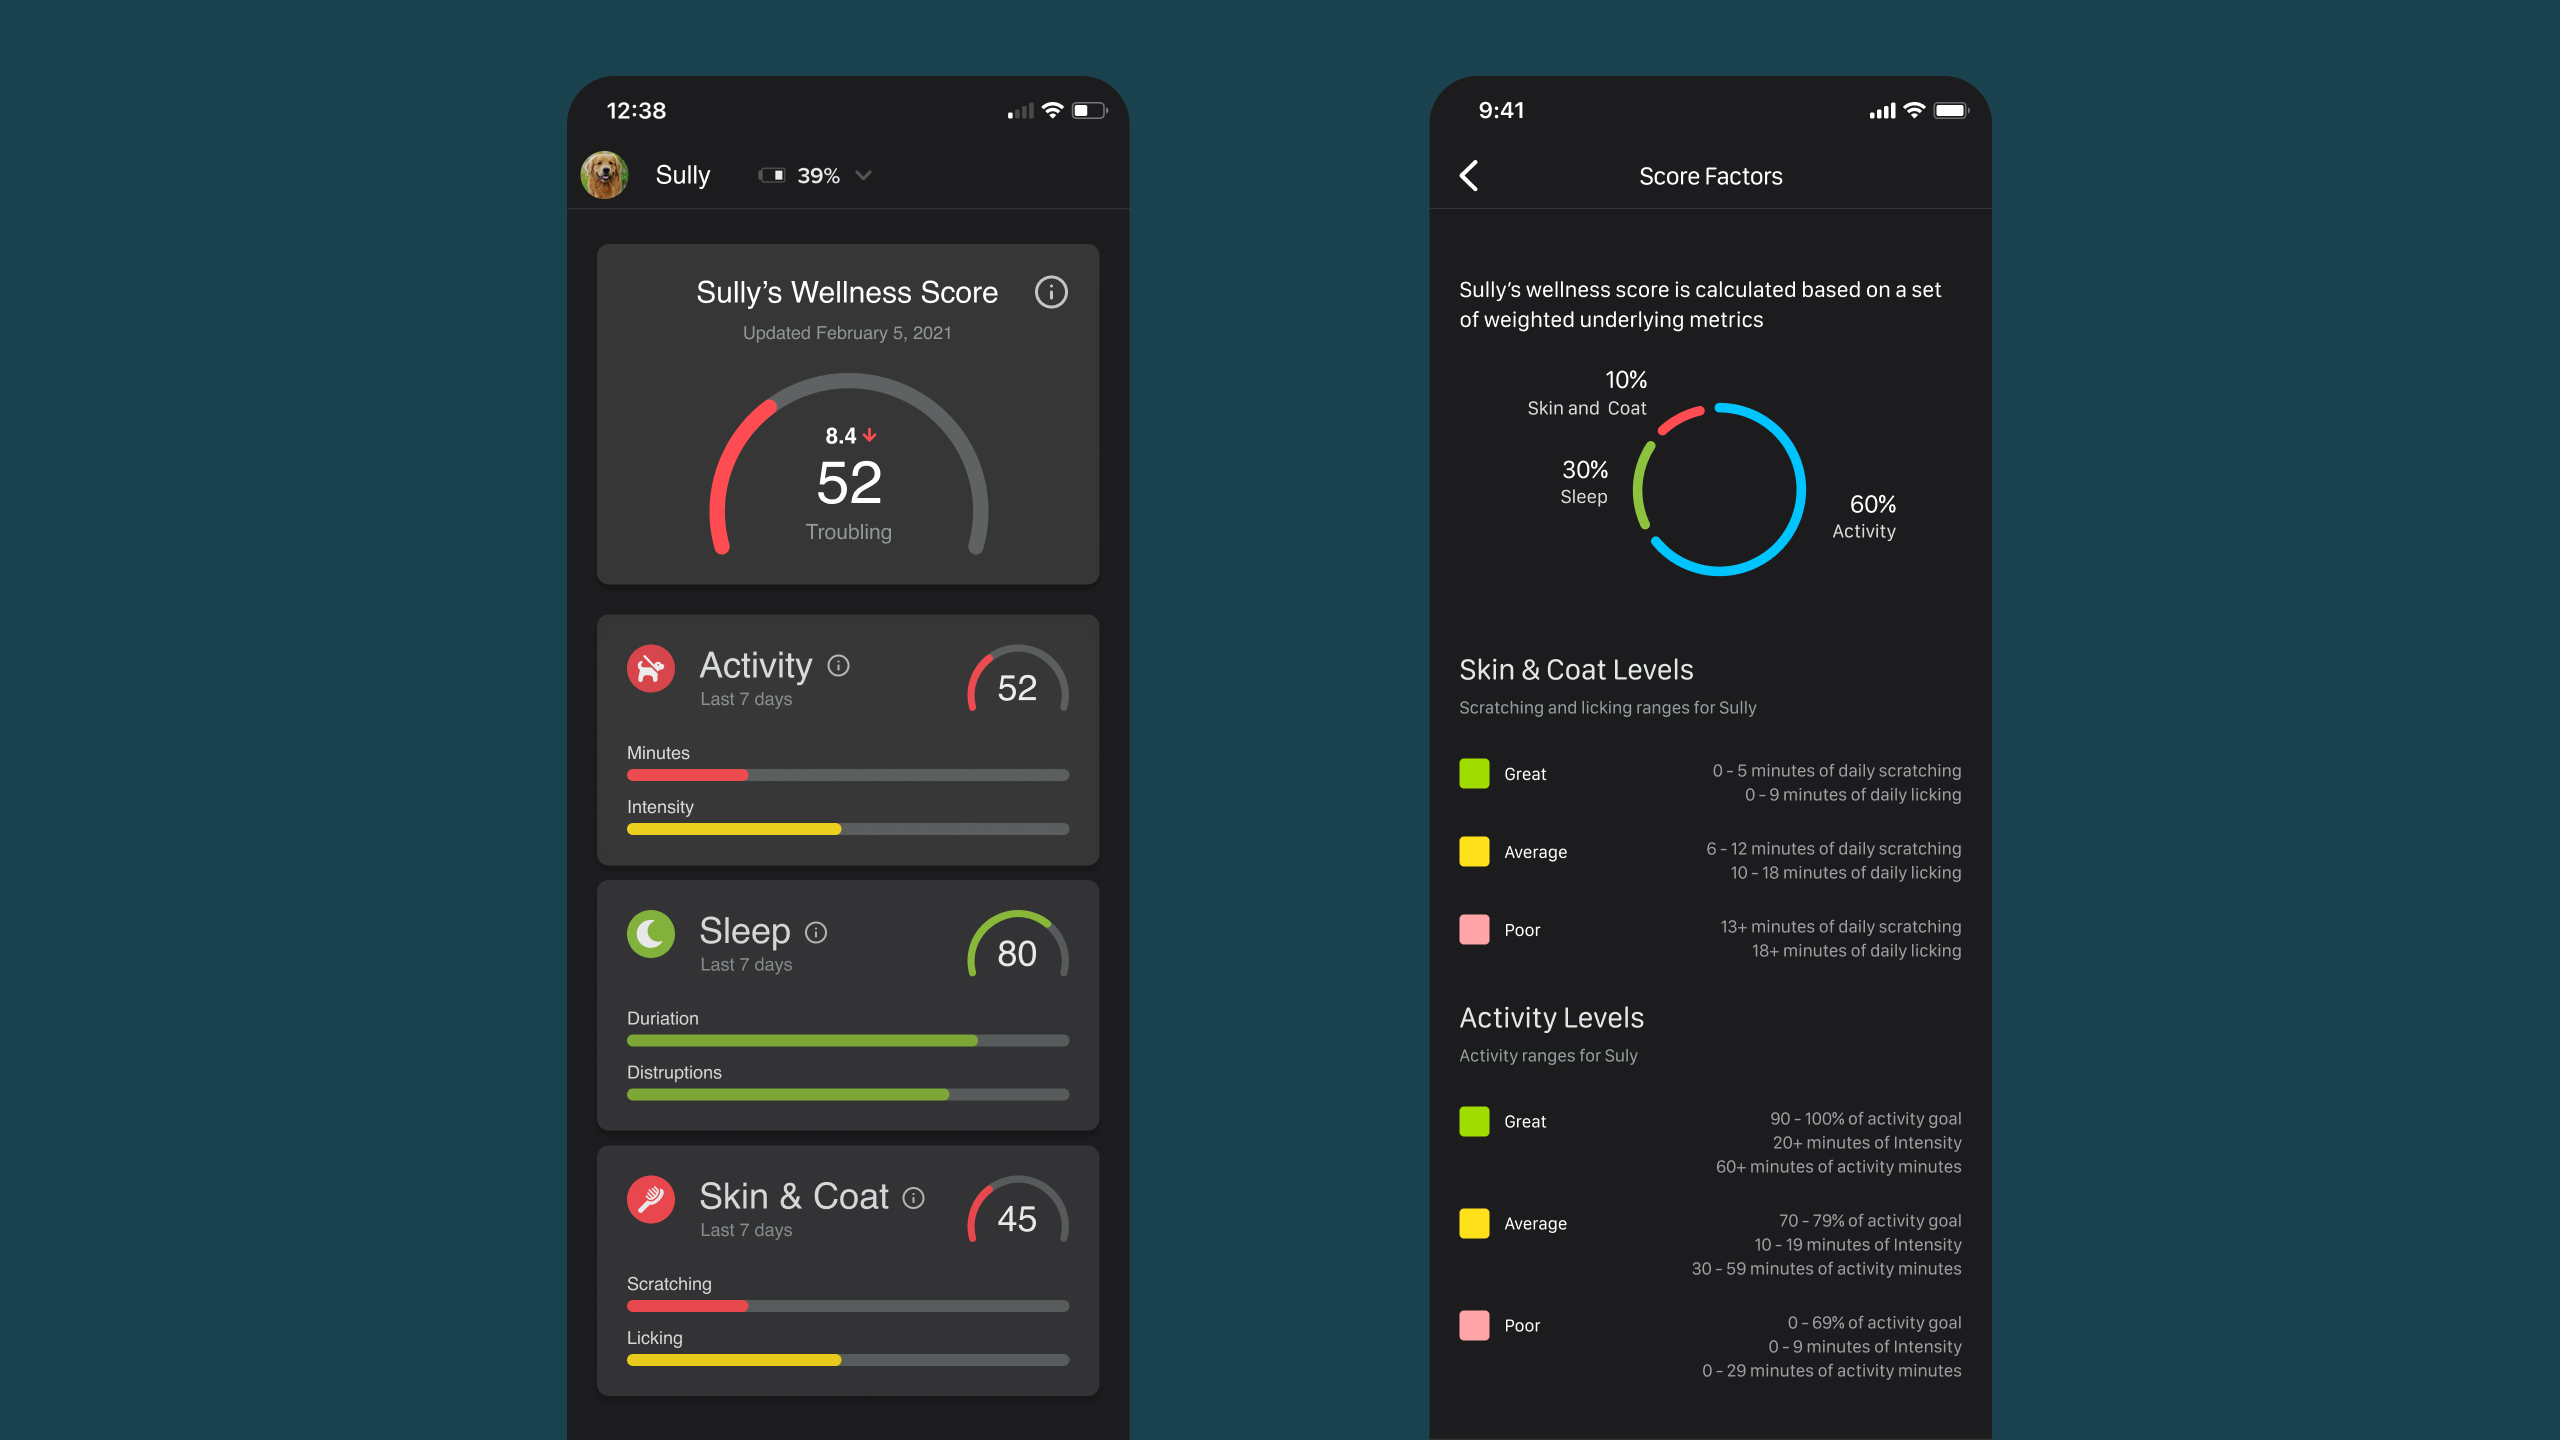
- Health scores without context. The app generated a "wellness score" but owners didn't understand what drove it up or down, or what actions to take when it dropped.
- Vet-readiness gap. Owners wanted to share health data with their veterinarians, but the raw data wasn't structured in a way vets could quickly interpret during appointment. The app needed to serve as a bridge between continuous home monitoring and episodic clinical visits.
Collect Data
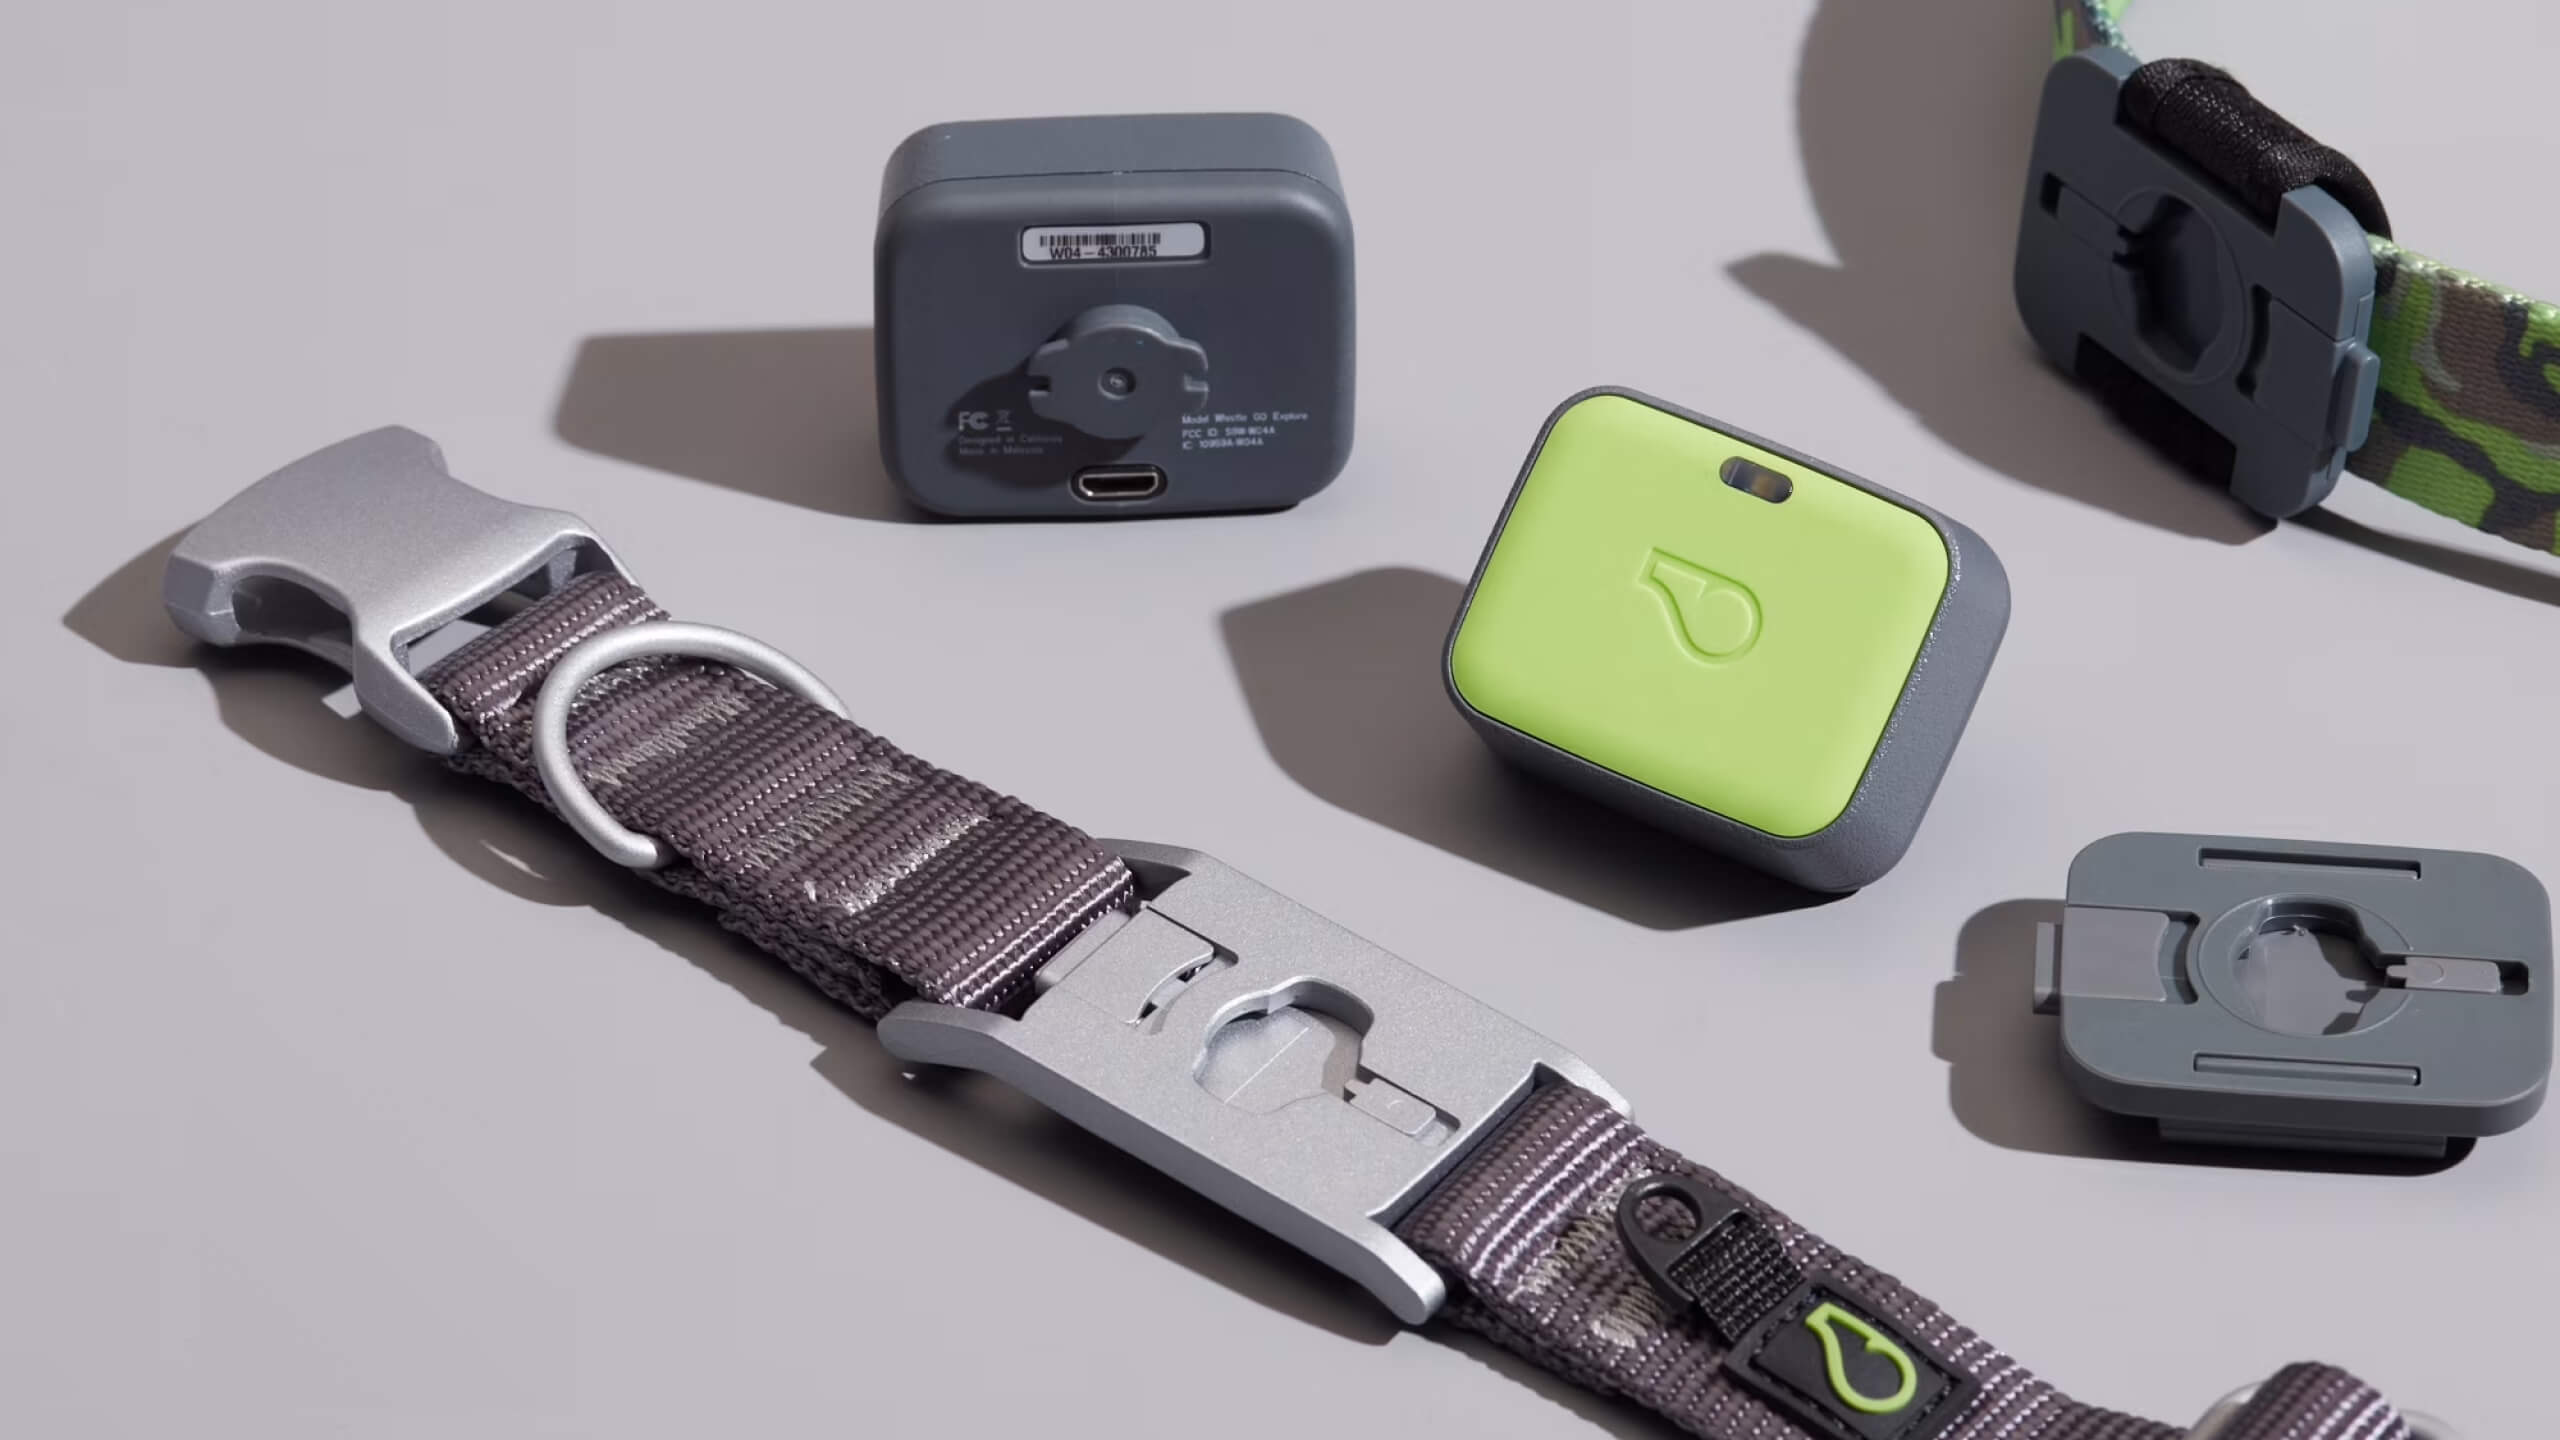
The design operated within a hardware-software system. The Whistle FIT collar device continuously tracked activity, sleep, and location. This data flowed into the app automatically. But the device couldn't capture everything. Subjective health indicators like skin condition, appetite, or behavioral changes required owner input through the app's habit tracker.
This created the core design constraint: the dashboard had to merge two fundamentally different data types (continuous sensor data vs. intermittent human observations) into a single coherent health picture.
Design Solution
Rather than a single fitness tracker, we designed a layered health system:
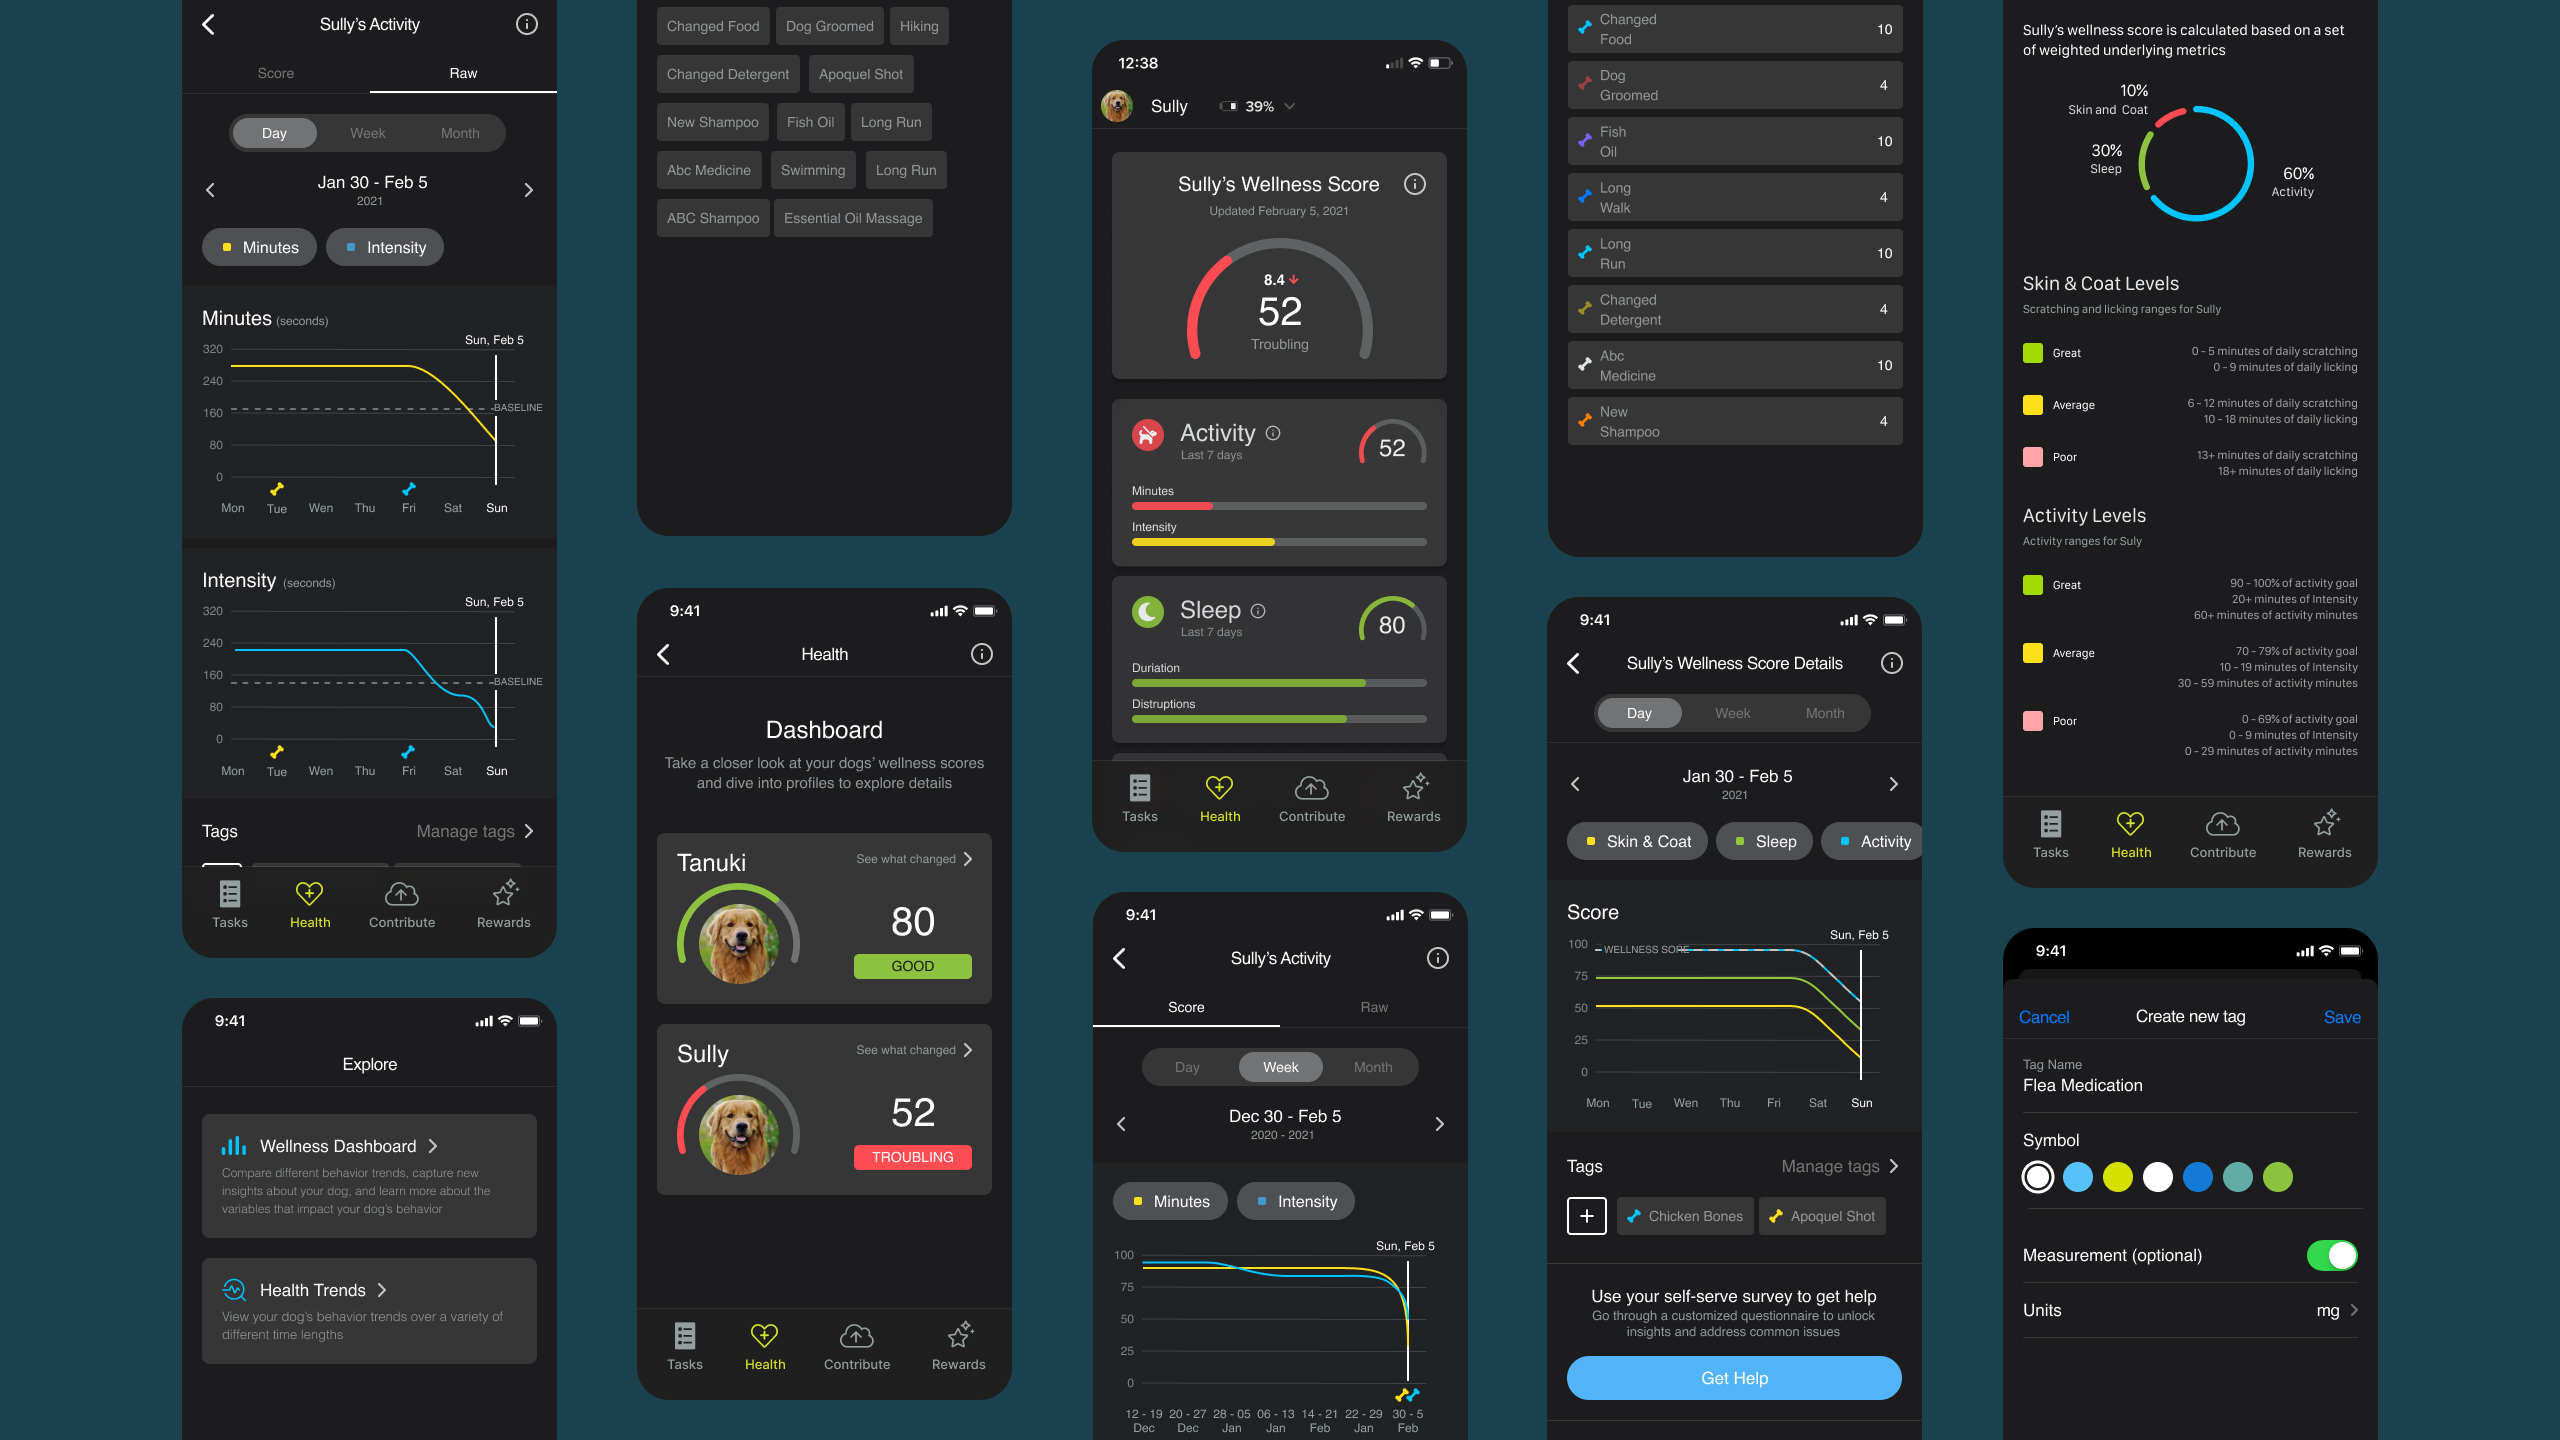
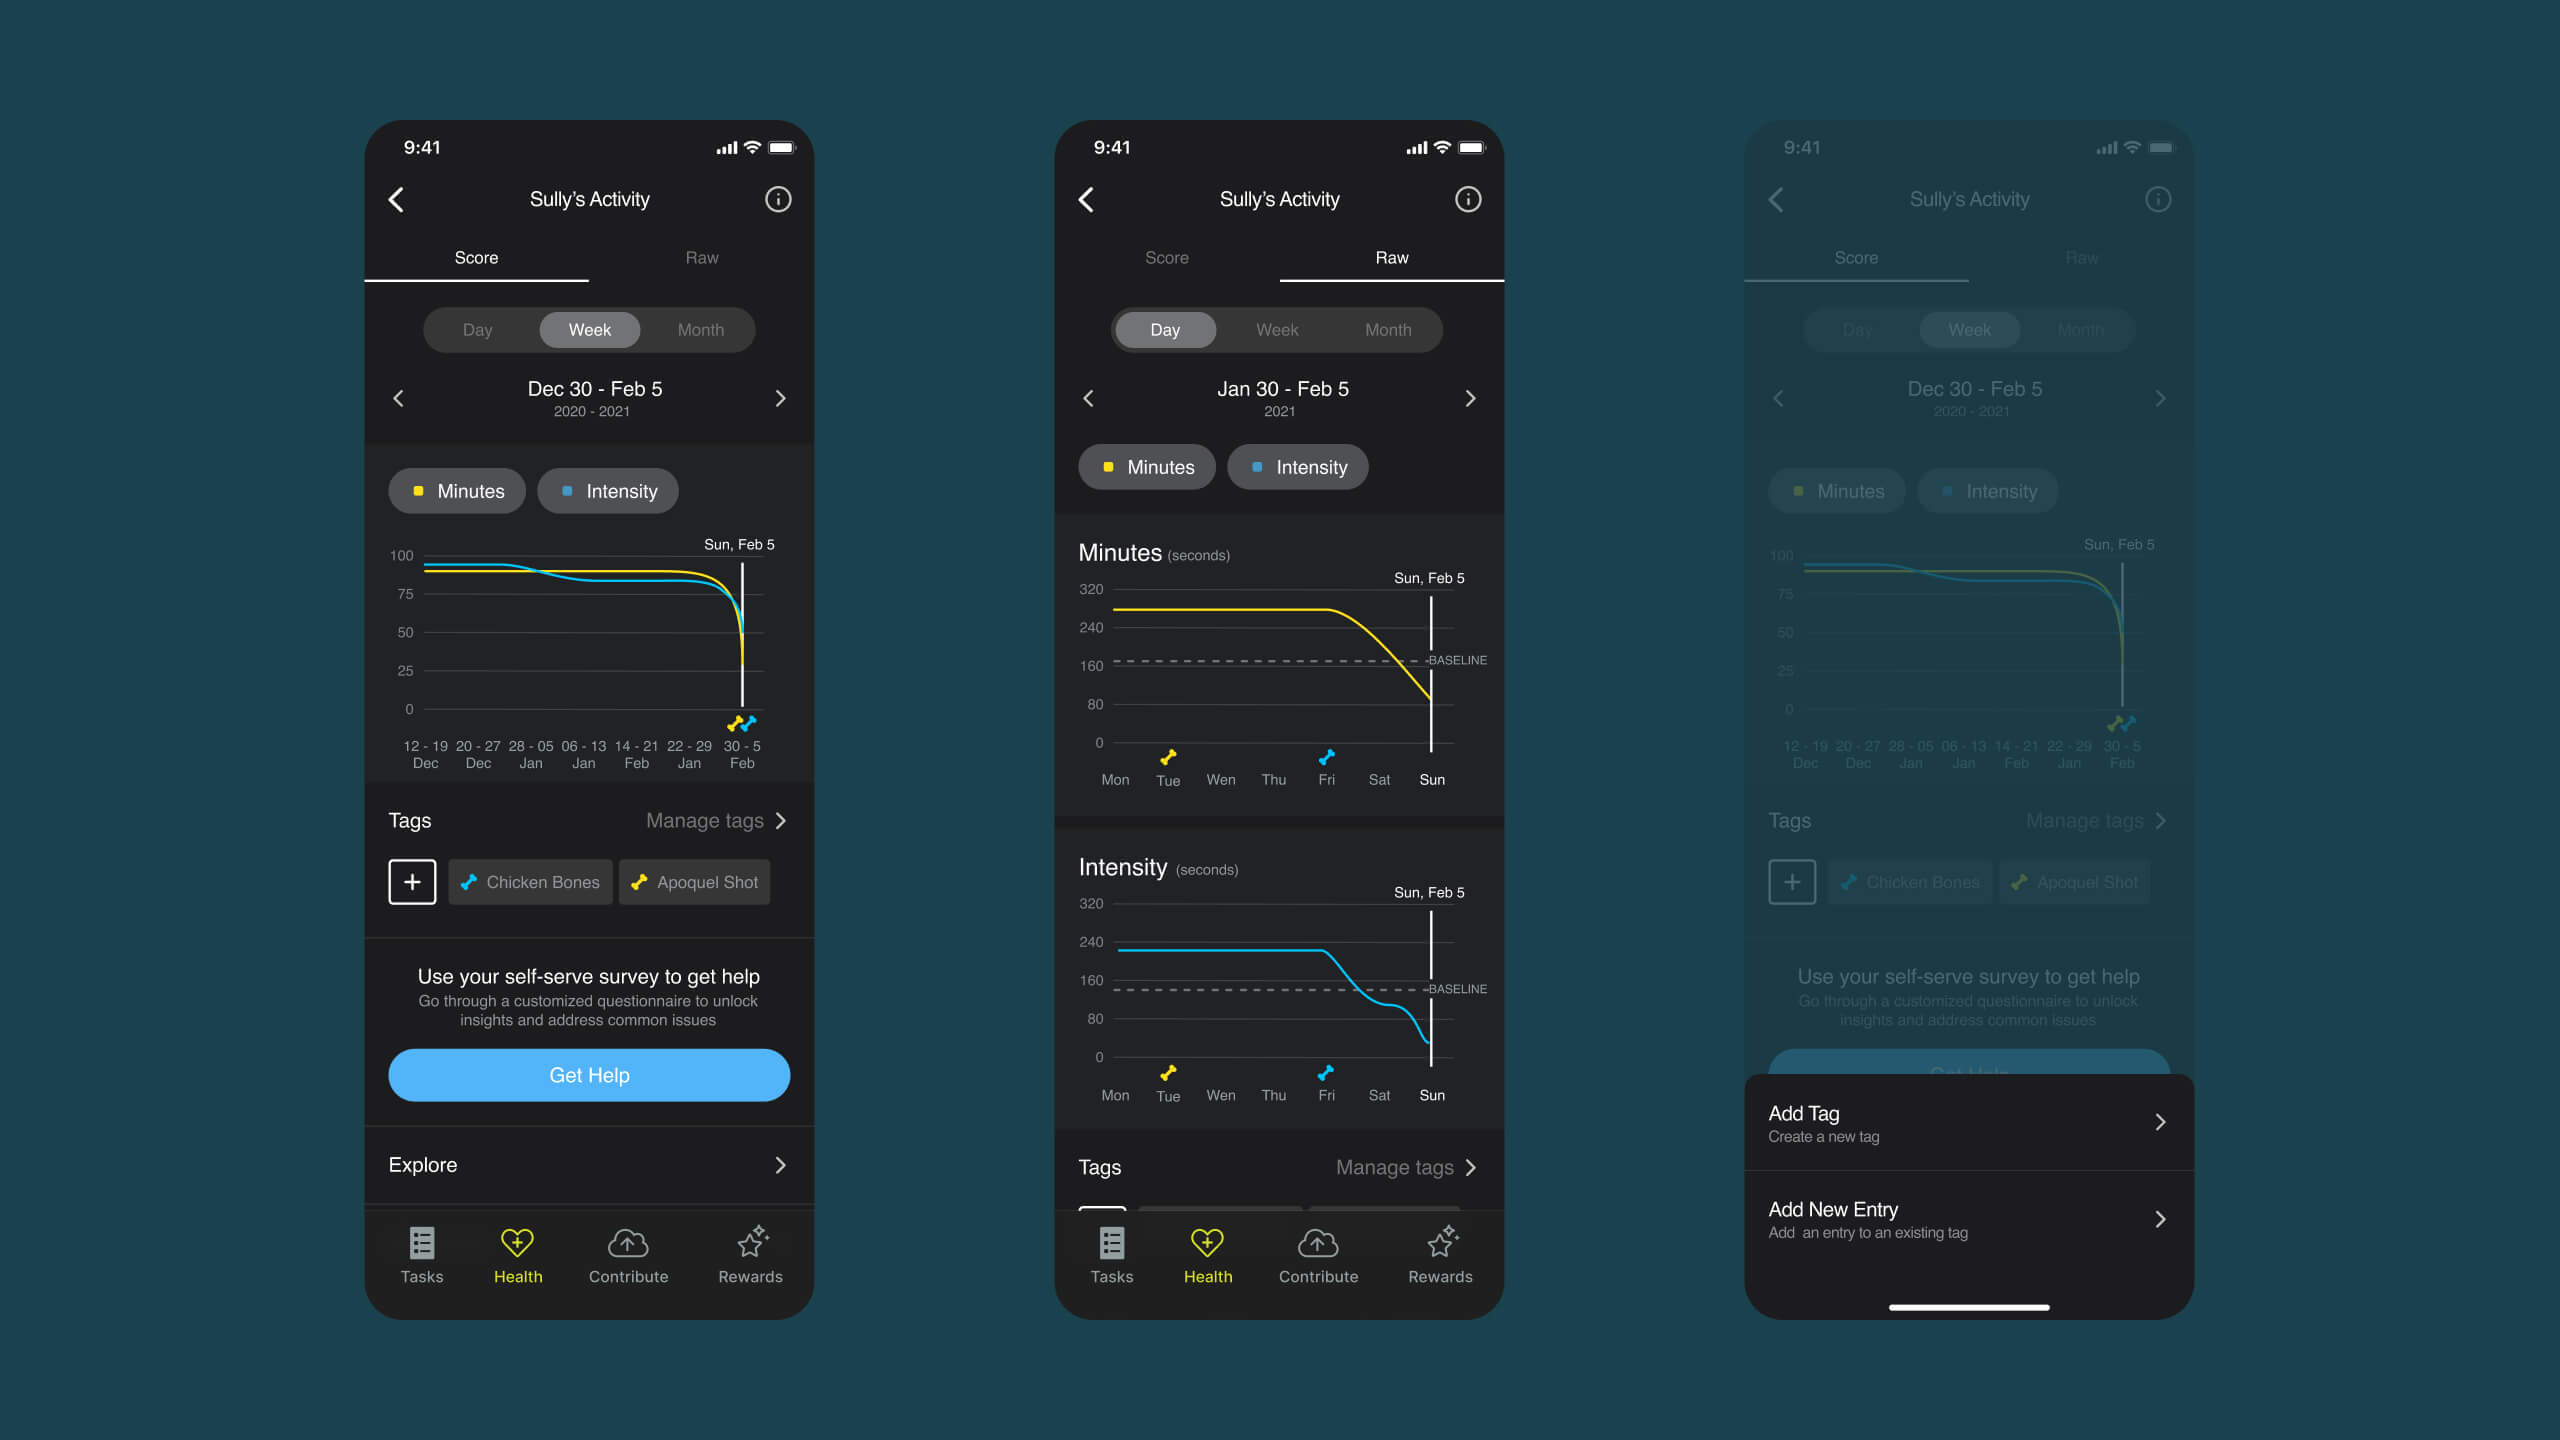
Wellness Dashboard
Aggregated score combining activity, sleep, and behavioral observations. Color-coded for at-a-glance assessment. Pet owners needed a quick answer to "Is my dog okay?" before diving into details.
Personalized Baseline Comparison
Instead of comparing pets to averages, each pet establishes their own baseline over 30 days. Daily values are compared to this personal normal, flagging significant deviations.
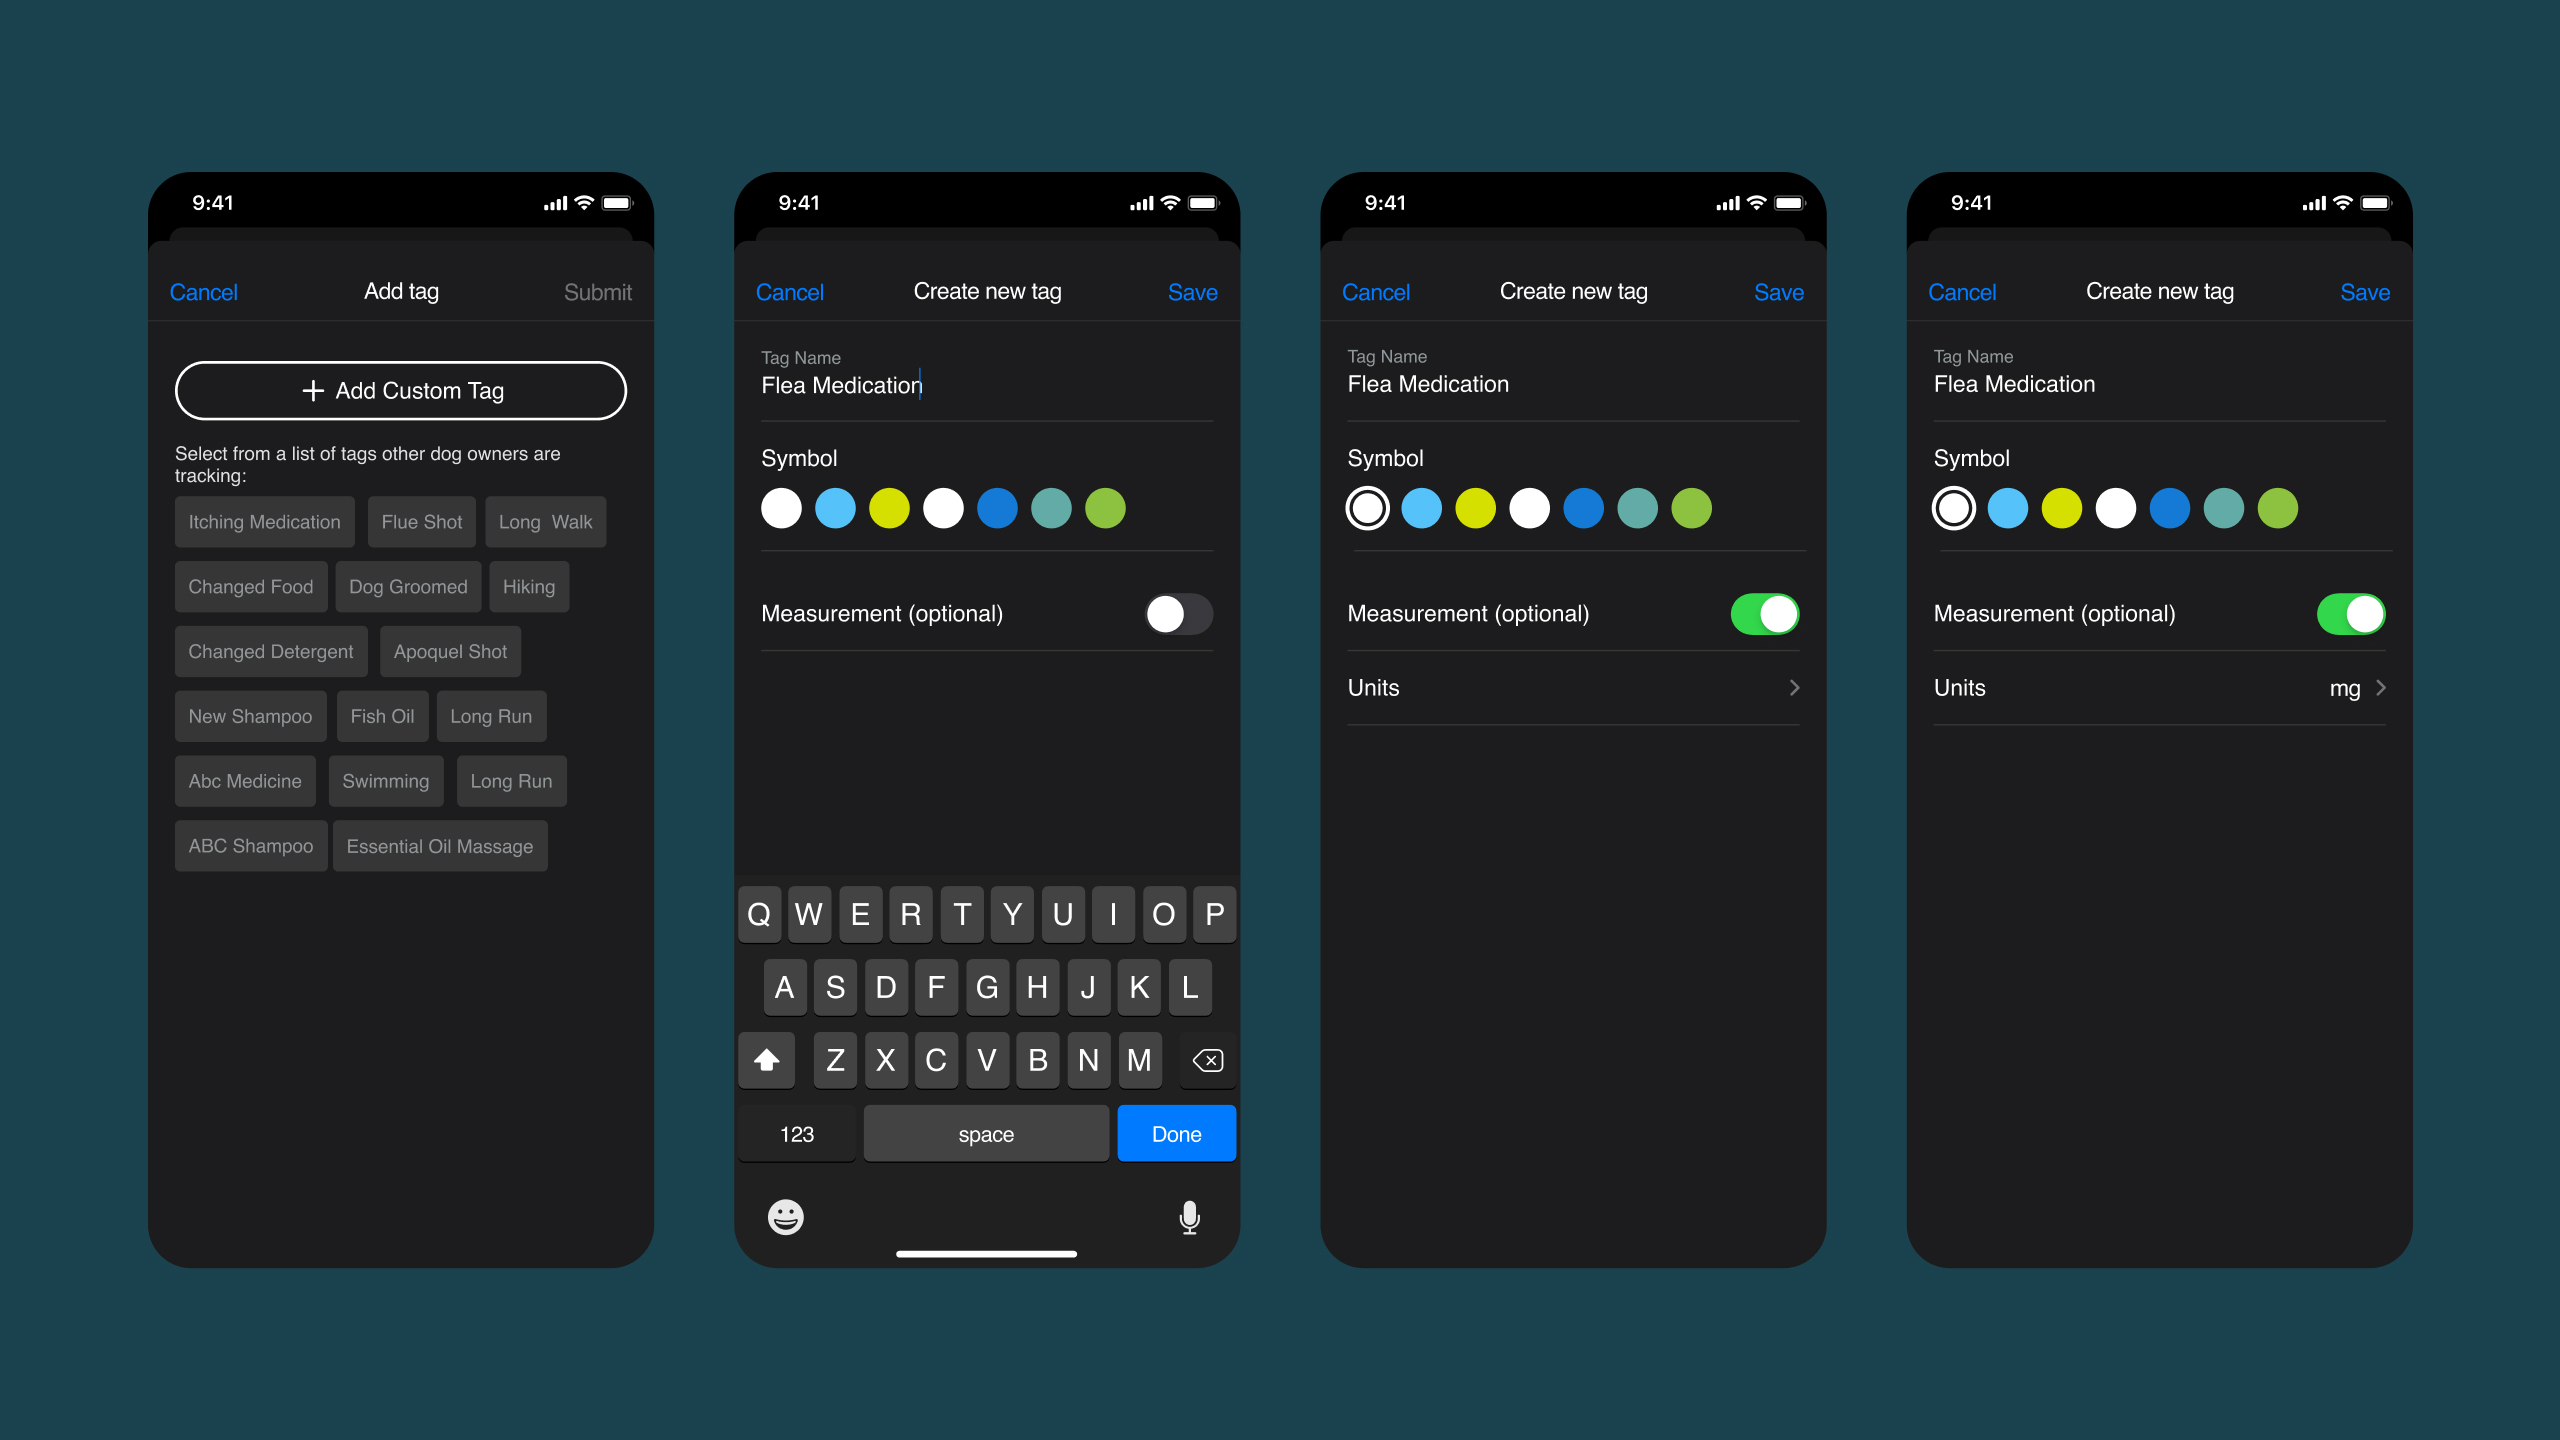
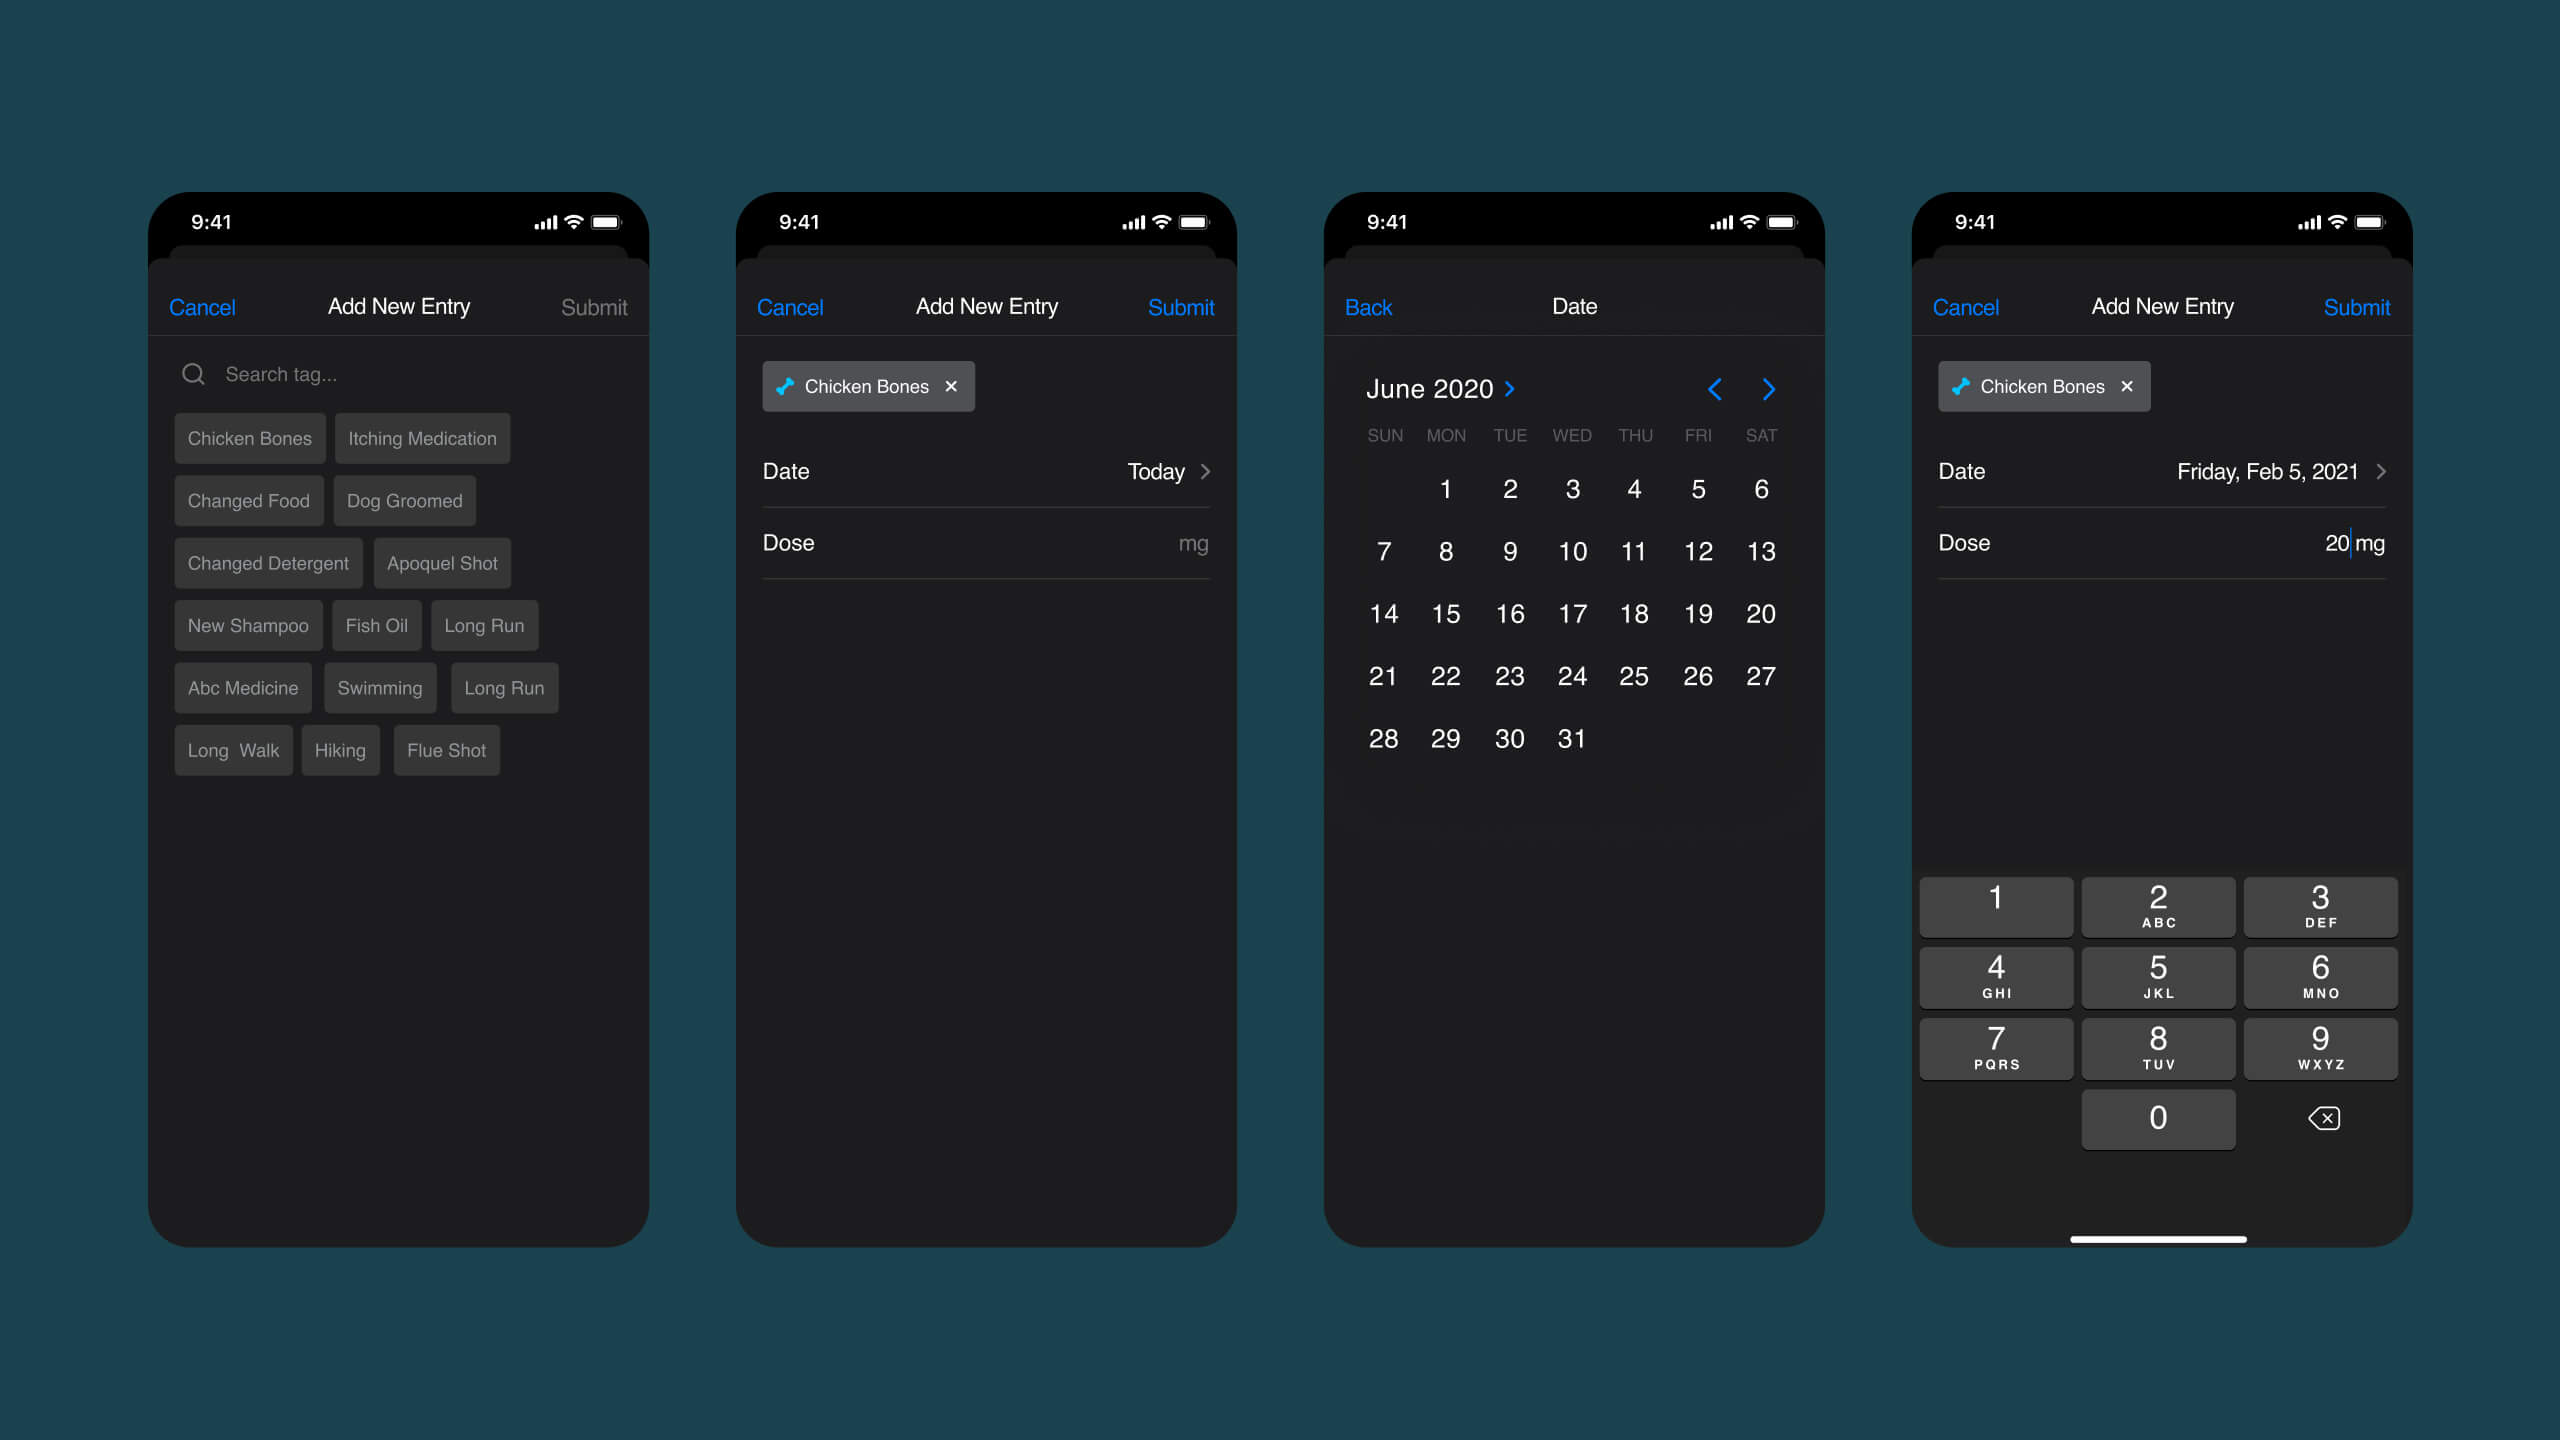
Habit Tracker (Manual Observation Layer)
Devices capture movement and sleep, but can't detect scratching, appetite changes, or limping. We added a quick-log system for observable symptoms.
Veterinary Integration
We designed exportable health reports matching veterinary intake forms, 30-day trends, logged symptoms, and timestamps in clinically useful formats.
Impact
Launched in Q2 2021 to Whistle's 150,000+ device users. The personalized baseline system became the foundation for expanding into sleep quality, mobility tracking, and behavioral analysis.
Key insight
Health data UX is fundamentally different from health data science. The algorithm team optimized for accuracy. I optimized for actionability. A wellness score that's 95% accurate but uninterpretable is worse than an 80% accurate score with clear context and next steps. This tension, precision vs. comprehension, shaped every design decision on the project.